Commercial Scale & MOQ

MOQ Is Not a Barrier — It's a Planned Commercial Variable

We turn MOQ pressure from a barrier into a planned commercial variable. Order volume, model complexity and fabric type are calculated together.

Commercial Scale & MOQ
Scroll Down
Smart Reading

MOQ Decision Framework

MOQ is not just a minimum quantity; behind it lie interconnected trade decisions such as stock risk, cash flow balance and production efficiency. Reading MOQ correctly means managing these three balances at the same time.

Production Compound

MOQ is the compound of line setup cost, raw material minimum lot size and production line efficiency threshold. A minimum set without these three variables in view leaves either idle capacity at the factory or hidden cost on the brand side.

Calculate setup and lot cost together; a realistic MOQ only forms on this compound, while a number based on one variable leaves the production line idle.

Stock Risk

Order quantities above actual need lead to unsold stock and tied-up cash. Stock risk is not only warehousing cost; it covers missed seasons, value loss and a drop in liquidity; a quantity decision without a sales forecast triggers all three at once.

Tie order quantity to your sales forecast; excess stock slows the cash cycle, creates missed-season risk and the old collection rarely returns from the shelf.

Cash Balance

The link between order size and payment terms demands real planning discipline. A large order brings a lower unit price per piece; yet a long payment term puts pressure on cash flow and can delay investment in the next collection.

Plan order size together with payment terms; a lower unit price often does not justify the cash pressure that surfaces in the middle of the season.

Cost Distinction

A low unit price does not always mean low total cost. Hidden costs such as storage, waste, missed seasons and tied capital can reverse the unit price advantage entirely; the right comparison is made on collection total, not per unit.

Compare total cost not unit price; storage, waste and tied capital inflate the real price as hidden line items, and margin loss never shows up on the shelf.

Demand Forecast

The right MOQ decision is shaped by evaluating sales forecast, warehouse capacity and cash cycle together. An order decision on a single variable disrupts the other balances; without modelling all three at once, the quantity rarely fits the season.

Merge sales forecast, warehouse and cash cycle in one table; an MOQ decision is only sound within this triple balance, and a missing column shows up mid-season.

Lot Optimization

Raw material minimum lot sizes directly affect order quantity. Lot-based procurement planning prevents excess stock and lowers cost by keeping batch balance across the supply chain; remaining fabric carries over to the next collection.

Integrate raw material lots into order quantity; excess stock and waste rate drop, and remaining fabric carries forward as a core item of the next season.

Controlled Start

Pilot Lot Approach

The first order is always a testing ground. The pilot lot approach validates market performance before scaling to high volume. A controlled start lowers the risk of tying heavy stock to the wrong product and leaves room to move mid-season.

Market Testing

Market Testing

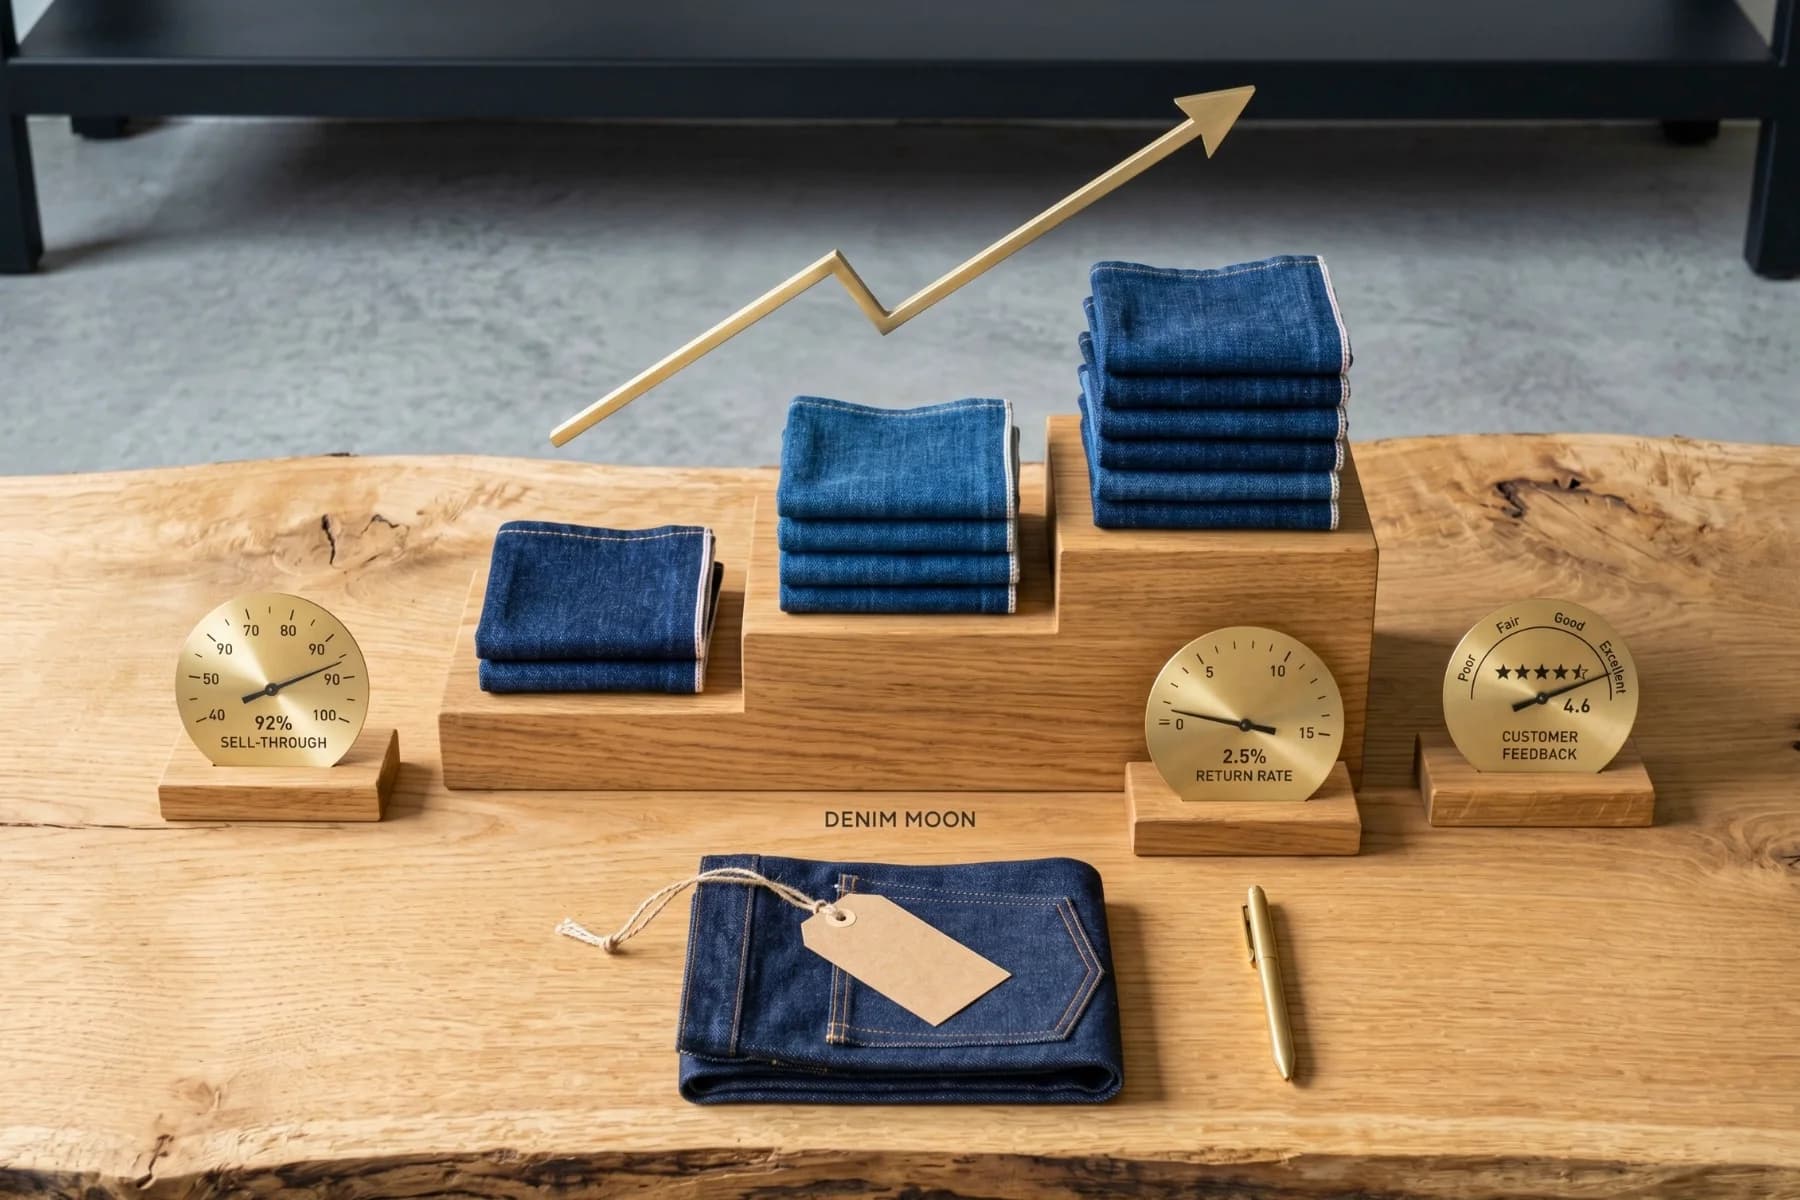
Initial order quantity can be kept lower for market testing purposes. This approach allows observing product sales performance under real market conditions. Volume increase without sales data leads to stock risk and cash tie-up. The pilot lot is the first step in keeping this risk under control; return rate, sell-through and fit feedback are read together.

Validate First
Small Scale Trial

Small Scale Trial

All production steps — pattern, sample, approval and serial run — are experienced at small scale first. This trial enables detecting process errors and bottlenecks before moving to high volume. Scaling before the process matures leads to costly corrections and delays; a revision made at small scale does not stop the main production line.

Process Maturity
Data Driven Growth

Data Driven Growth

The scaling decision is made on pilot lot results; growth runs on real data. Sell-through rate, return rate and customer feedback determine the next order volume. Growth decisions not backed by data carry the risk of excess stock and cash flow pressure; a high MOQ set without data is most often revisited one season later.

Data Priority
Volume Discipline

Volume Discipline

Not scaling to high volume until sales performance is validated keeps stock risk under control. Large orders based on unverified demand cause unsold inventory and cash loss. Pilot lot discipline prevents volume increase without sales proof and limits financial risk; the scale decision is made only when the first batch sell-through report is on the table.

Minimize Risk
Category Flexibility

Category Flexibility

Pilot lot conditions can vary by product category and production model. Minimum lot sizes and line setup times differ across product groups such as denim, knit and woven. The right pilot lot strategy provides flexibility by taking category specifics into account; the same pilot ratio may translate to 200 pcs in denim and 350 pcs in knit.

Flexible Planning
Continuity Template

Continuity Template

Successful pilot lot results form the base of the next order cycle. Approved references, quality standards and production parameters are archived; the next order does not start from zero. This readiness speeds up scaling and shortens lead time by holding production consistency; usually only the size break or shade is updated on the next batch.

Archive Ready
Phased Growth

Gradual Scaling Strategy

Growth does not happen all at once. Gradual scaling means raising order volume step by step on sales performance and market demand. Planning runs proactive not reactive; every step is verified with data and the table is reopened each cycle.

Phased Volume Increase

Phased Volume Increase

Order volume is raised step by step on sales data and stock turnover rate. Every increase step relies on the prior period sales performance. Volume increase without data carries excess stock and cash pressure risk. The phased approach keeps this risk under control; the scale moves to the next step only when the sales report meets the target.

Step by Step
Cost-Stock Balance

Cost-Stock Balance

At each scaling step the balance between unit cost and stock risk is reassessed. Higher volume lowers unit cost but if stock turnover slows the total cost rises. The right balance point is found by analysing sell-through rate and warehouse capacity together; this analysis is updated twice — at season start and mid-season.

Balance Point
Capacity Coordination

Capacity Coordination

Capacity planning is coordinated in advance to accommodate growing volume. Production line capacity, raw material lead time and workforce plan are clarified before the scaling calendar starts. Volume increase without coordination leads to delivery delays and quality deviation; the plan is opened to both contractor and buyer ahead of each scaling decision.

Plan Ahead
Season Calendar Sync

Season Calendar Sync

The scaling calendar is synced with the season cycle and campaign plan. Production volume increase must run parallel to sales seasons and retail calendars. Off-season scaling creates unsold stock risk and warehousing cost. Calendar sync supports the cash cycle by keeping stock turnover steady; SS and AW launch dates are locked in at the start.

Season Aligned
Payment Term Discipline

Payment Term Discipline

The gradual approach supports sustainable growth by reducing the pressure on cash flow. Increasing volume in phases instead of one large order keeps payment terms manageable. Protecting the cash cycle means sustaining the balance between stock investment and sales revenue; the payment window is planned to match the season movement.

Sustainable Cash
Target-Based Scaling

Target-Based Scaling

Each scaling step is tied to a predefined sales target and stock turnover ratio. The next phase does not start until the target is met; every step is backed by performance data. This discipline removes emotional decisions from the process and places growth on measurable ground; if the threshold is not reached, the scale stays flat for that season.

Measurable Progress
Transparent View

Cost Variables Map

Unit price is not a single figure but a compound of several variables. Understanding them moves price comparison beyond the cheap-versus-expensive trap into a strategic decision; real cost shows only when every line item is on the table.

Fabric Selection

Fabric Selection

Weight, composition and origin directly affect unit cost. Two fabrics with the same look can have very different price points due to different weight and yarn structure. Fabric cost is the largest single item in total unit price and the right choice sets the balance between quality and cost; the meter price of ring-spun and open-end yarn shifts each season.

Right Fabric
Wash & Process

Wash & Process

Wash type and process count are added directly to the cost structure. Different techniques — enzyme, laser, ozone, hand sanding — reflect on unit cost at different rates. As process count rises unit cost climbs; the balance between desired look and budget comes through wash recipe optimization, and a laser–ozone mix often gives the most efficient outcome.

Process Optimization
Order Volume Impact

Order Volume Impact

Higher order quantity lowers the per-unit share of line setup and raw material costs. However volume increase must be balanced with stock risk and cash tie-up. The optimal order quantity sits where unit cost advantage meets stock turnover speed, and this point differs for each category; it forms around 800 pcs in denim and 1,500 pcs in basic knit tees.

Volume Balance
Accessories & Trim

Accessories & Trim

Components such as buttons, rivets, zippers and labels are part of the total cost. Premium accessory selection raises unit cost but strengthens brand perception. The balance between accessory quality and price is set by the target market segment; each trim item is tracked as a separate line, and end-of-season count drift is caught from those lines.

Detail Costing
Packaging & Delivery

Packaging & Delivery

Channel-based packaging requirements can create additional cost items. Retail, wholesale and e-commerce channels require different packaging standards and labeling formats. Packaging cost is often overlooked but at high volumes it makes a notable contribution to total cost; polybag print and hanger pack are processed as separate lines for different channels.

Channel Planning
Total Cost Analysis

Total Cost Analysis

The gap between unit price and total cost is the foundation of the strategic decision. A low unit price does not include hidden items such as storage, waste, missed seasons and tied capital. Proper cost analysis combines all variables in one table to reveal the real cost; an offer that looks cheap often turns out costly on the collection total.

Single Sheet
Cumulative Edge

Reorder Economics

Reproducing a successful product can be more efficient than the first run. In reorders the pattern, fabric and approval processes are already defined; both time and cost are saved. Proper reference management keeps this edge alive.

Short Cycle

Development Speed

Pattern, colour and wash references are ready from the first run, so development speeds up. No sample work from scratch is needed and the approval cycle shortens; the four-to-six-week first-order period drops to two weeks on the reorder.

Steady Supplier

Supply Continuity

Supply chain continuity is maintained when the same fabric and accessory supplier continues. A supplier change carries quality deviation and delay risk; yarn from the same mill and the same dye bath hold tone consistency across seasons.

Check Sample

Sample Simplification

The sample process simplifies in reorders and approval stages reduce. Since the reference set is approved, a check sample replaces the full sample run; lab dip and PP sample are skipped, and a size set confirmation replaces the fit sample.

Falling Unit

Scale Advantage

Economy of scale strengthens as order volume grows and unit cost drops. Line setup cost and raw material lot share spread over the rising quantity; on the second order unit cost falls by roughly 5–8%, and from the third order it stabilises.

Approved Set

Reference Preservation

Preserving the reference set is the base of product consistency and customer satisfaction. Approved pattern, colour card and wash recipe are archived with a version number; the gold seal sample is held in lab conditions for two years.

Regular Flow

Order Cycle

The reorder calendar is planned on sales data and stock turnover rate. A regular order cycle eases capacity allocation on the line; the weekly sales report ties to the production plan, and the capacity block is reserved at season start.

Delivery Management

Season Campaign Planning

The right product loses its impact when delivered at the wrong time. Season and campaign planning is a term management framework that aligns production with the sales calendar; the first date slip cascades into the last.

Launch Date
01

Launch Date

Season launch and campaign start dates are the starting point of all term planning. The sales calendar is converted into a production calendar and every stage counts back from these dates. Fabric, sample approval and production lead times are calculated backward; three months before launch the fabric is approved, four months before the pattern is closed.

Backward Planning
02

Backward Planning

The production start date is set by working backward from the target delivery date. The minimum duration of each stage is defined and logged into the calendar. Sample approval cycle, fabric lead time and cutting plan join the countdown; backward planning makes critical dates visible before bottlenecks form, and delay-prone steps are flagged weeks ahead.

Supply Lead Time
03

Supply Lead Time

Fabric supply lead time, sample approval cycle and production duration are integrated into the calendar. The average delivery time for each supplier is logged and planning runs on this data. An alternative supplier list is ready for critical materials; deviation surfaces early and the previous season's lead-time data forms the base of the new plan.

Buffer Management
04

Buffer Management

Buffer time is planned against external factors during campaign and inter-season transitions. Risks such as customs delay, raw material disruption and approval delay are included in the buffer calculation. Buffer duration is set on order volume and supply chain complexity; the standard buffer is held at 7–10 working days on the main calendar.

Early Planning
05

Early Planning

As the delivery window narrows flexibility decreases; early planning preserves room to maneuver. Advance capacity reservation secures a slot on the production line. An early order creates a price advantage on fabric and trims; late planning raises urgent production cost, and a plan packed into the final six weeks leaves no room for revision.

Department Alignment
06

Department Alignment

Sales, design, procurement and production departments move on the same term plan. Cross-department information flow runs through one calendar file and update history is fully on record. Term conflict is spotted early and a resolution meeting is scheduled; the calendar file is brought to the table in a weekly ritual, and no item stays open.

Stock Assurance

Rapid Replenishment

When best-sellers go out of stock it means lost sales and lost customers. The rapid replenishment framework manages stockout risk for top performers and keeps sales continuity intact; the trigger is set before the threshold is crossed.

Data Watch

Sales Velocity Tracking

Sales velocity data is monitored regularly and an early warning activates as stock approaches the threshold. Data-driven monitoring makes stockout risk visible in advance; the weekly sales report turns into a daily report at mid-season.

Template Lock

Reference Set Control

The approved reference set is preserved for best-sellers and reorder lead time is minimised. Pattern, colour card and wash recipe stay fixed and a new sample is not required; the gold seal sits in the archive and reaches the line on demand.

Pre-Staging

Material Reserve

A continuity stock or pre-staging approach is planned for fabric and trims. Critical raw materials are reserved in advance and supply delay risk drops sharply; reserve volume is calculated on average sales velocity and supplier lead time.

Trend Analysis

Quantity Setting

Reorder quantity is set on the sales trend and remaining season time. Demand forecast relies on actual sales data and overstock risk is kept under control; two months before season end the quantity turns defensive rather than aggressive.

Risk Balance

Stock Optimization

A dynamic balance is managed between stockout risk and overstock risk. Stock level is reassessed at every order cycle and the quantity is adjusted to current demand; the economic order quantity is calculated separately for each best-seller.

Quick Trigger

Order Activation

When the stock threshold is crossed the reorder process activates rapidly. Since the reference set is ready the production order is placed quickly and lead time shortens; the first replenishment delivers in three to four weeks, then in two.

Ready Data

Scale Planning Inputs

A few core inputs must be ready before MOQ and scale planning can be done right. These inputs directly determine the MOQ proposal as well as the term and cost estimate; a plan built on missing inputs gets corrected mid-season.

Style Structure
01

Style Structure

How many models, colour and wash variations, and which size range the order covers is clarified. Scope ambiguity directly impacts MOQ calculation and the cost estimate; one model in four colours at 800 pcs differs sharply from four models in one colour at 800 pcs on the line, and this input settles the difference before the quote is built.

Target Volume
02

Target Volume

Initial order quantity and the annual total volume target are defined. This volume directly sets the scale tier and the unit cost range; unclear volume makes cost estimation harder, MOQ band runs very differently between 500–1,000 and 2,000+ units, with the quote structured accordingly, and an annual plan reads on a different template than a one-off run.

Sales Channel
03

Sales Channel

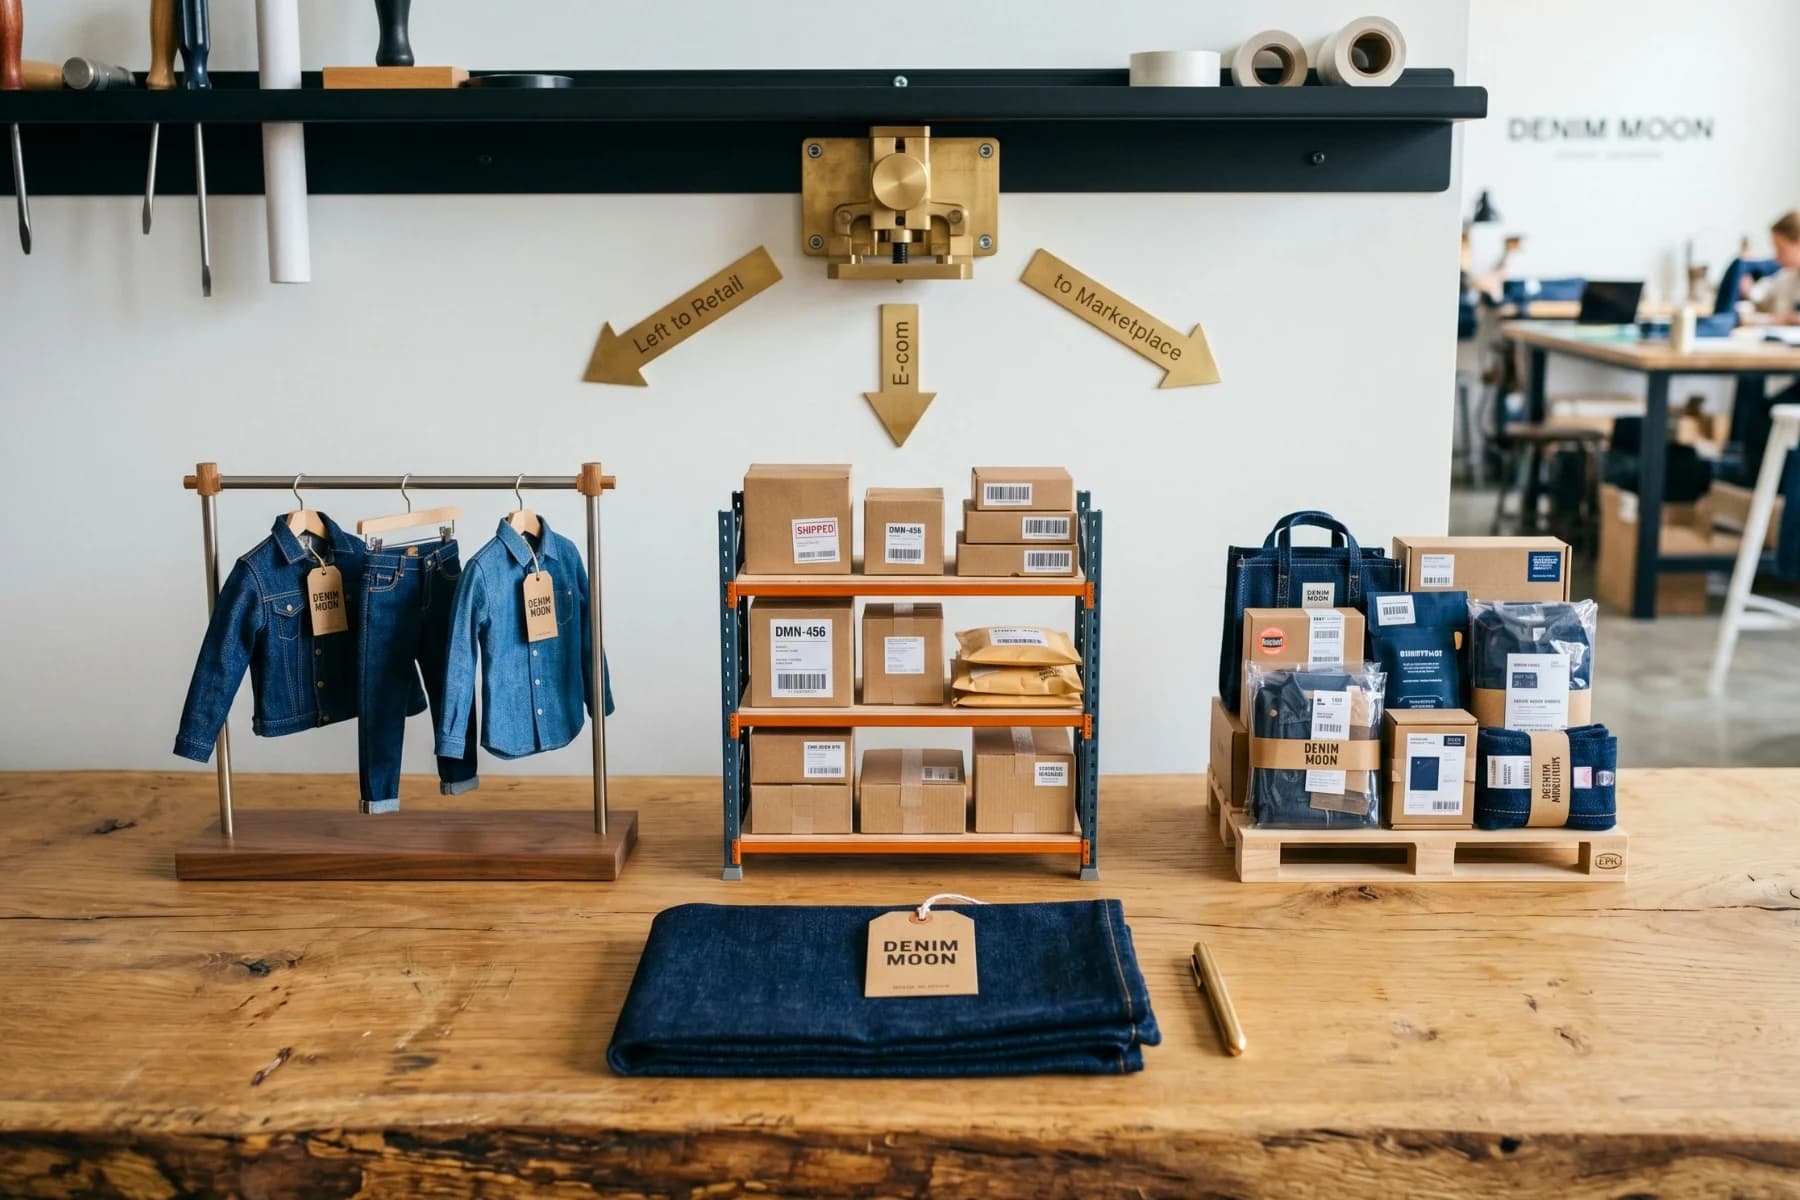
Store, e-commerce or marketplace; each channel has its own stock management and delivery format. Channel data sets the starting point for storage, packaging and shipment planning; polybag print for e-commerce and hanger pack for retail are tracked under separate files, and marketplace requires extra labelling and barcode format locked into the contract.

Shelf Date
04

Shelf Date

When products need to be on the shelf or in the warehouse is the starting point of all term planning. Without calendar data the production start date and supply lead time cannot be calculated; the SS shelf date is taken as mid-January, AW as early July, the production calendar counts back from there, and any risky window surfaces upfront.

Reorder Expectation
05

Reorder Expectation

If best-seller management and rapid reorder need exist, this must be stated upfront. Reorder expectation directly affects the reference set, material continuity and capacity plan; when a reorder target is set, part of the fabric is held as continuity stock, around 20% of the first order is kept in reserve, and the second wave delivers in three weeks.

Budget Framework
06

Budget Framework

A target unit cost range or total budget limit clarifies the cost and volume balance. Without budget data the scale proposal and fabric selection cannot be structured properly; the typical unit cost band runs 12–18 USD for mid-tier and 22–35 USD for premium, and the budget target is read against this band.

Clear Numbers

Three-Page Plan

A meeting is not a Q&A for us, but the fastest way to draw the numerical frame of the scale plan together. In the first session MOQ band, volume and calendar are matched; a written scale proposal and unit cost range reach you afterwards.

One Session

MOQ Band Decision

Which MOQ band fits your needs is clarified in a thirty-minute meeting. Order volume, model complexity and fabric type are calculated in the same session; by the end it is clear whether 500–1,000, 1,000–2,000 or 2,000+ band will start.

48 Hours

Written Scale Plan

Within 48 hours of the meeting a written scale plan and unit cost range reach you. The document covers MOQ band, volume tier, raw material estimate and timeline order; instead of verbal confirmation you receive a clean file you can comment on.

Same Line

Single Commercial Contact

From meeting to shipment the whole scale planning process runs through a single project manager. Volume, price, payment and shipping questions all reach you from the same person; the team handles internal coordination, the buyer does not.

Clear Band

Plan Your Commercial Scale Meeting

Let us define your MOQ and scale plan on volume target, season calendar, sales channel and budget frame. In the first meeting we set the right scale band and the starting scenario together; a written proposal reaches you afterwards.

Select a form to display here.

How Do Your Products Reach You?

Explore our end-to-end shipment infrastructure and delivery model — from warehousing to customs, from road to sea freight.

Explore the Network
Denim Moon © 2026 · Powered by Dimotihe